
4 ways to drill down on mastitis data for your herd
 © Kathy Horniblow
 It is common practice to use mastitis and cell count patterns to see which broad area of risk is responsible for a herd’s infections.
Various software packages, along with programs such as AHDB’s Mastitis Pattern Analysis Tool, signal whether main infection risks are from the dry period or lactation and suggest whether environmental or contagious bacteria predominate.
See also: 7 ways to make the most of milk recording data
About the author

However, within these areas of risk, there are still many individual factors that may be responsible for udder health problems.
Without pinpointing these specific risk factors, we cannot make targeted decisions on the best interventions.
Fortunately, the finer details of our udder health data can help narrow down the key causes of mastitis issues.
1. Analyse infection rate by group
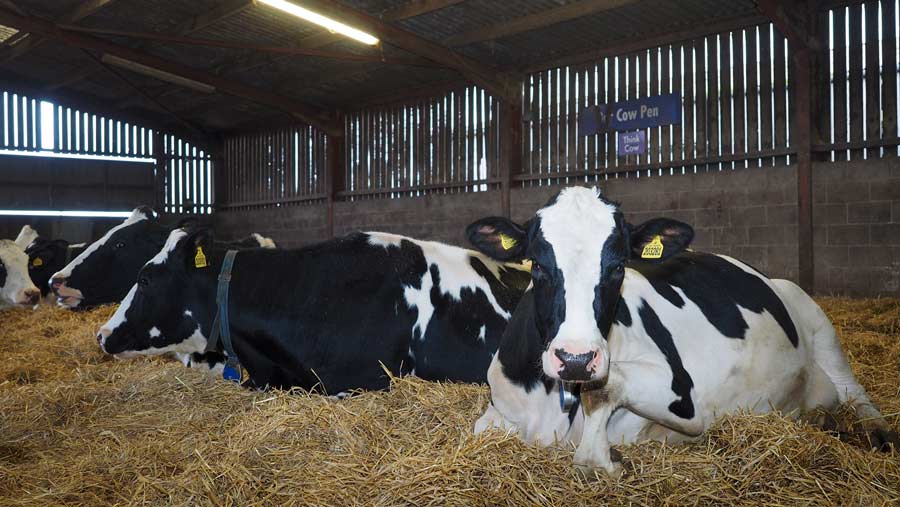
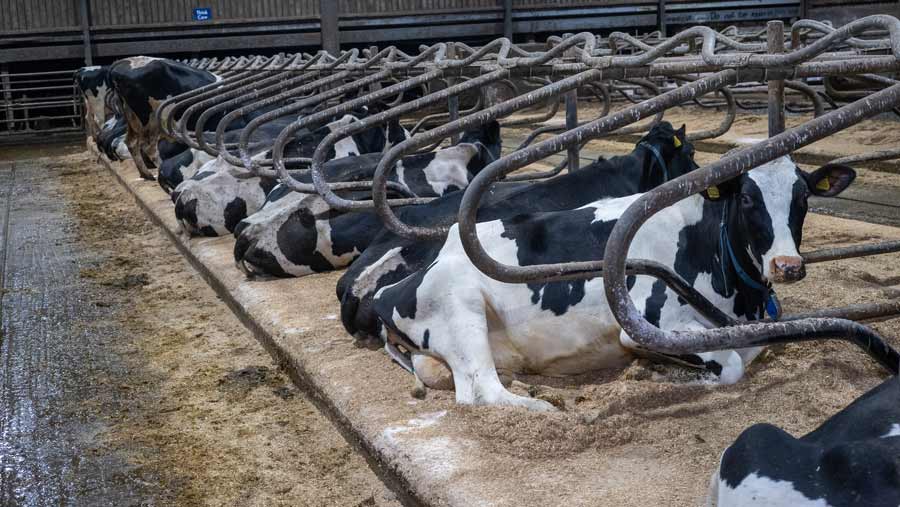
Environmental mastitis problems may be linked to one specific building. By analysing udder health data by group, any pens with higher infection rates can be identified.
Infection rates in different buildings may be influenced by animal factors, such as age or stage of lactation, but are also often affected by different environmental conditions.
Analysing the data by housing group can highlight the need to investigate risk factors such as ventilation, pen infrastructure, slurry management and stocking rate in individual buildings.
© Kathy Horniblow
2. Examine distribution of cases throughout lactation
Infection risk is normally highest at the start of lactation and steadily reduces as days in milk increase. Changes to this pattern can indicate unusual risk factors, allowing us to investigate further.
When infection rates peak at 90-120 days in milk, it can be a warning sign that cows are not coping with the demands of peak yield, prompting us to run tests for metabolic function.
It can also be an indicator that bulling cows are sustaining more infections than target, reminding us to review the environment and management of this group.
Another useful indicator is if we see infection rate staying at the same level throughout lactation, rather than decreasing.
This is commonly seen in herds suffering from teat-end hyperkeratosis, as this mastitis risk increases over time because of ongoing exposure to inappropriate milking machine settings.
When mastitis rates “flatline”, or even increase, over lactation, a teat score and dynamic test of the milking machine are advisable.
3. Evaluate infection rate by lactation number
Infection risk generally increases with age, leading to higher mastitis rates with each subsequent lactation.
On average, second-lactation animals will have 125% of the mastitis rate of heifers, and third calvers will have 125% of the mastitis rate of the second-lactation cows.
We can use this pattern to see if specific age groups are experiencing more infections than expected.
If the heifer mastitis rate is too close to that of the second-lactation cows, and the problem is in the first month of lactation, an unhygienic pre-calving environment may be the cause.
If infections are spread throughout the first lactation, they may be associated with poor-fitting liners for the heifers’ smaller teats.
Larger than usual increases in mastitis rate between subsequent lactation numbers are often caused by milking machine factors, especially when infections are distributed throughout lactation.
If machine settings and liner choice are causing hyperkeratosis, teats tend to get rougher with each successive lactation, leading to higher mastitis risk in older animals.
Alternatively, if most older cow infections are in the fresh period, it may be a consequence of metabolic risk factors, such as hypocalcaemia.
4. Use extra information to evaluate dry period risk areas
Somatic cell count data can be compared before and after a dry period to measure cure rates and success in protecting dry cows from new infections.
Relationships between protection and cure rates can indicate whether environmental challenge or issues with dry cow therapy are the cause.
When performing selective dry cow therapy, we can assess performance by group: cows treated with antibiotics versus those receiving teat sealant only.
This allows us to fine-tune our protocols, as well as improving management techniques.
General disease data can also reveal risk factors for dry cow infection.
For example, higher-than-target levels of calves born dead may be caused by trace element imbalances.
These mineral deficiencies are also a risk for mastitis, so we can use stillbirth data to check whether improving mineral supplementation over the dry period may be helpful at reducing fresh cow infection rates.
Extra checks
Numbers on a screen never give a conclusive diagnosis of a problem – there are often several possible scenarios that may explain the same pattern. It is vital to perform extra checks to confirm your suspicions.
However, evaluating the data can be extremely helpful in directing on-farm investigations, saving time and money by pinpointing areas for improvement more efficiently.