
How new tech aims to improve soil carbon measurement
 © Agricarbon
 Measuring soil organic carbon accurately has always been difficult.
But with the rise in interest in carbon trading in agriculture, as well as the other benefits from managing carbon stocks in soils, companies are looking at alternative methods of measuring soil organic carbon that meet the key criteria of accuracy and affordability.
Robust measurement of soil carbon stocks – total soil carbon, not just soil carbon percentage – and how it changes over time is critical to providing evidence to governments, food businesses and other corporates that soils really are removing carbon dioxide from the atmosphere and storing it.
See also: Carbon audit highlights priorities for net-zero success
Techniques being developed to provide that evidence include sensor technology, improving the throughput and accuracy of physical soil sampling, and advanced data analytics.
Farmers Weekly spoke to a company involved in each area.
Measuring variability
Historically, soil organic carbon has been measured through physical laboratory analysis of soils, but there are a number of limitations, according to Jacquie McGlade, chief scientist and co-founder of Downforce Technologies.
Cost and in-field variability are key limitations: how do you measure that variability while keeping costs in check?
Traditionally, variability might be measured by taking a number of cores in one location, but they are often put into one sample bag, explains Prof McGlade.
“That’s counterintuitive, because you’re trying to understand variability and by mixing it, you are losing important information.”
© Downforce-Technologies
Cost limitation
W-pattern individual samples can give some appreciation of variability, but cost often reduces the number of samples analysed, she says.
“Sometimes it can be just one sample per hectare. We’ve done a lot of hyperlocal sampling and you can detect as much variability in 10sq m as the whole field.
“That’s a challenge for sampling, as you can sample carefully and spend a lot of money and not be very clear on what it is representative of,” she suggests.
Variation also occurs within the soil profile vertically.
“As you go down the soil profile, you lose more of the effects of the crop and more of the effects of the microbiome come in. What careful researchers do is take a core and not disturb it and then cut it into 5cm layers in the laboratory.”
She likens some current sampling protocols to trying to determine a photographic image using effectively just a few pixels from several million data points.
The answer to improving that resolution lies in harnessing big datasets, according to Prof McGlade.
Using big data
Regular satellite data, for example, is readily available.
“You can tell a lot about crops from satellites, and while it is more difficult to say much about soils, it is possible. Soils have lots of features that can help you learn about carbon.”
It’s not just satellite data. Data taken by proximal sensors, measuring electromagnetic conductivity, gamma radiation and spectral emissions, such as visible near infrared, also provide a lot of useful information, which can be linked to global positioning systems to provide highly accurate measurements, she says.
“Each of these different data sources have their own strengths for what they are good for – for example, spectral data is good for soil carbon, while gamma radiation tells you about cations such as potassium.
“However, it is very expensive to get these surveys done unless you own the instrument, so at Downforce we’ve created a data fusion process.
“We take the best data from multiple locations and those stored in public libraries to create global datasets. In some countries, such as the UK, we use national datasets to add even more detail.”
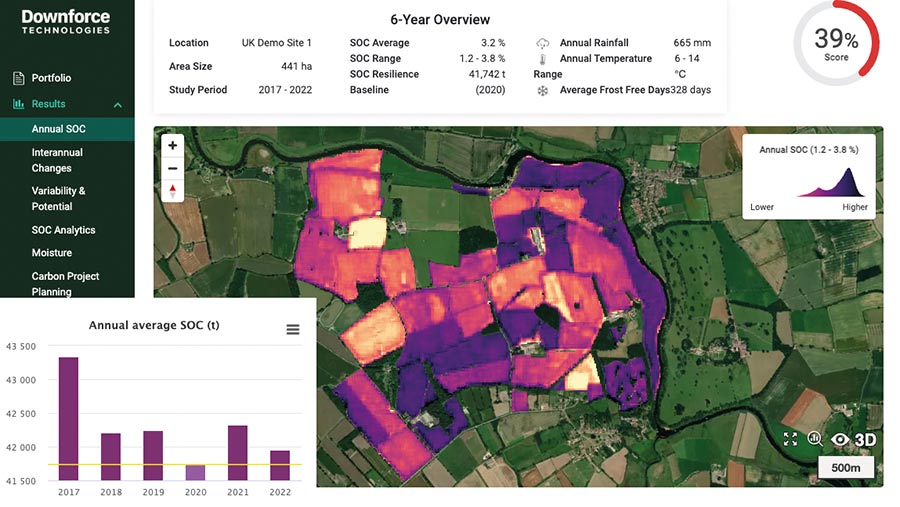
From that a virtual model – a digital twin – is created, which can be updated using real-time data, and uses simulation, machine-learning and reasoning to predict how, in this case, soil organic carbon has or will change in the field, she explains.
“To do that you need to understand the science of why soils change, and bring in other data such as climate data, to bring it all together in the digital twin.”
The result is a powerful tool, which, she says, can look back using satellite and other data to show how soil carbon and other soil characteristics have changed over time in 10sq m patches of fields every 10 days.
Downforce Technologies is primarily using the tool with supply chains to help assess how farms are doing on the journey to net zero.
Working at such a large scale brings the cost down to about £1/ha, although costs to individual farmers would be higher.
“For the first time we can provide an accurate measure of carbon removals,” claims Prof McGlade.
“Farmers are interested in whether they are net positive or negative, and that leads to questions about how to reduce emissions.
“For the retailer it provides an overall picture of all the farms together and the data to prove whether the supply chain is net zero.”
Resilience
It also gives an indication of resilience for farmers, she adds.
“So, if it is very hot or dry on land that is not very resilient, you can see it loses soil carbon very quickly – that interannual fluctuation is a strong measure of soil health.”
In Australia, that information is being used by farmers to help obtain business loans, while on a management level the analysis can help determine whether interventions are making a difference in a short time frame.
“Sometimes, within three to six months you can see a difference, but it depends on the soils.”
Initial results on farm have also shown that rotation, even different varieties of wheat, can have an effect on carbon build-up in soils.
“We can see that if you do certain things in your rotation you can accumulate carbon in the soil. Sometimes that means the last crop in the rotation has a bumper yield because there is so much more carbon built up.
“So we can become field- and crop-specific about your likely outcomes for soil carbon and soil health.”
Scanning for soil emissions
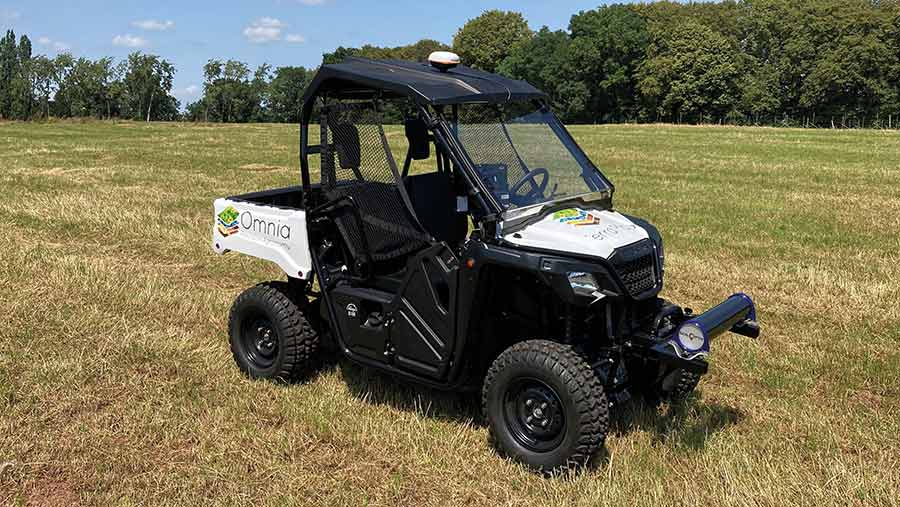
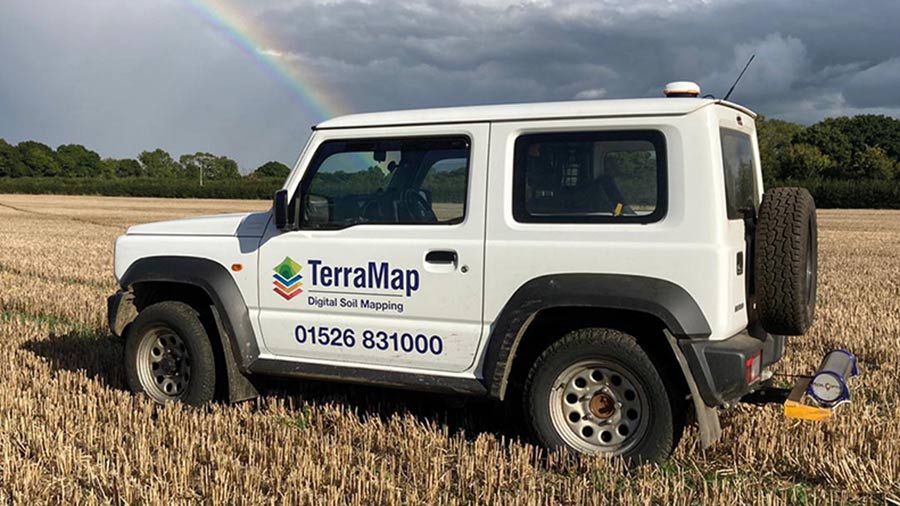
Hutchinsons’ TerraMap Carbon service uses a metre-long, tube-like passive sensor usually fitted to a lightweight all-terrain vehicle to pick up gamma radiation that is naturally emitted from soils.
A scaled-down version of sensors fitted to aircraft and used for mineral prospecting, the technology has been developed for agriculture by Canadian company SoilOptix, explains Matt Ward, Hutchinsons services leader.
“It senses four naturally occurring radioactive isotopes – caesium, potassium, thorium and uranium, which, depending on the levels of each, infers different soil characteristics.”
Omnia Dynamic © Omnia
Ground truthing
Once the field has been scanned, typically at 10-12mph in 12m swathes using a scanner height of 60-70cm, an algorithm in the service software pinpoints five to eight locations in the field for ground truthing soil samples.
The resulting lab analysis is then used to generate a map using the variation detected by the field scan.
The technique can be used to map all common nutrients, pH, soil texture, organic matter, cation-exchange capacity, elevation, plant-available water, as well as both total organic carbon and active carbon – the percentage that is actively cycled in the soil.
The scanner measures carbon to a depth of 15cm in the soil profile.
Initial research with Adas and Niab when the service launched in 2021 suggested there was little difference in carbon depending on soil depth, but that’s being revisited this year, with an aim to measure to 30cm depth.
“Realistically, that’s the most you can sensibly influence through soil management,” Mr Ward suggests.
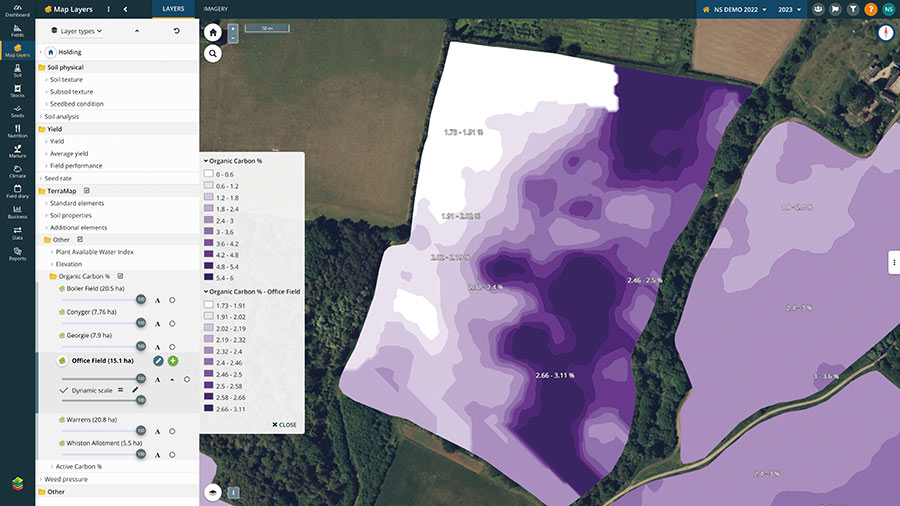
Maps are viewed and analysed within Hutchinsons’ Omnia platform, which enables fields to be compared using a fixed or dynamic colour scale.
The fixed scale prevents showing variation when, in reality, there isn’t much, Mr Ward says. The dynamic view divides each field into 10 different zones, from the highest to lowest levels.
“It’s important to understand in this view that while the scale colours for two different fields will be the same, the actual values can be completely different.”
© Omnia
Organic matter:clay ratio
Omnia uses scientific research demonstrating threshold ratios for soil organic carbon to clay content for different levels of soil condition to help farmers interpret results, creating a map that shows areas of the farm with degraded, moderate, good or very good soils.
“It helps farmers see which fields are actually good and which are not and start to focus activities.”
The standard service, which includes measurement of phosphorus, potassium, magnesium, pH, percentage of sand, silt and clay, elevation plus organic matter, costs £30/ha, and the standard carbon service, which also includes percentage and total organic carbon, costs £37/ha, Mr Ward says.
Improving soil sampling
One potential drawback of using emerging technologies such as sensors and modelling from earth observations is they don’t directly measure carbon in the soil, says Annie Leeson, chief executive officer of Agricarbon.
Instead, they determine what’s happening in the soil by drawing correlations between sensor and calibration data.
That creates two challenges: whether there is enough calibration data to ensure accuracy and whether the validity of the calibration can be maintained consistently over time as soil and climatic conditions change, she explains.
The result is added risk in whether there is enough accuracy and certainty to detect change in future, suggests Ms Leeson.
Traditional soil sampling is not much better, she admits. It’s expensive and inconsistent between labs, and even within the same lab.
Agricarbon app © Agricarbon
Lab variation
For example, a regular independent Wageningen University study last year of about 50 labs measuring soil carbon across Europe showed more than half were over 20% away from the correct reference value of the soil samples used in the trials.
Meanwhile, 60% were inconsistent in their analysis, giving results both higher and lower than the reference values of the four samples.
These were among the challenges Agricarbon was seeking to overcome when developing a high-throughput, industrial-scale soil carbon analysis service, along with designing a statistically robust sampling strategy for detecting soil carbon stock change over time, Ms Leeson says.
Sampling needs to achieve two things: to distribute samples in a way that is representative of the land being measured and ensure enough samples are analysed to detect statistically significant future changes in soil carbon, she says.
That’s a key minimum requirement for carbon markets, but requires a higher number of samples than traditional soil sampling usually allows due to cost.
© Omnia
To define the sampling strategy, Agricarbon considers project size, variability of soils and the expected increase in soil carbon the project is hoping to measure.
The most intensive sampling will require more than one soil core per acre, while larger projects may have lower intensity.
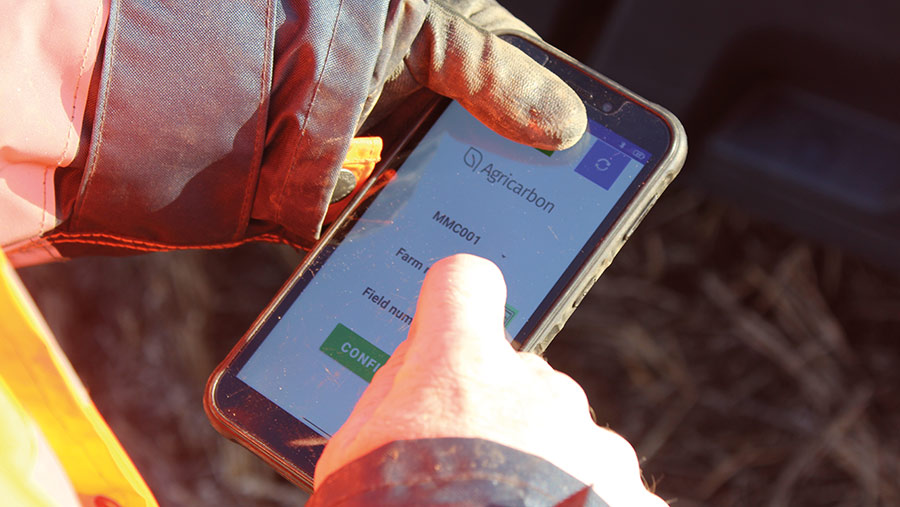
Once the sampling locations are defined, the GPS co-ordinates and a route-plan are sent to the field operations team using the Agricarbon app, which also tracks the collection, digital tagging and metadata associated with each soil core as it is extracted.
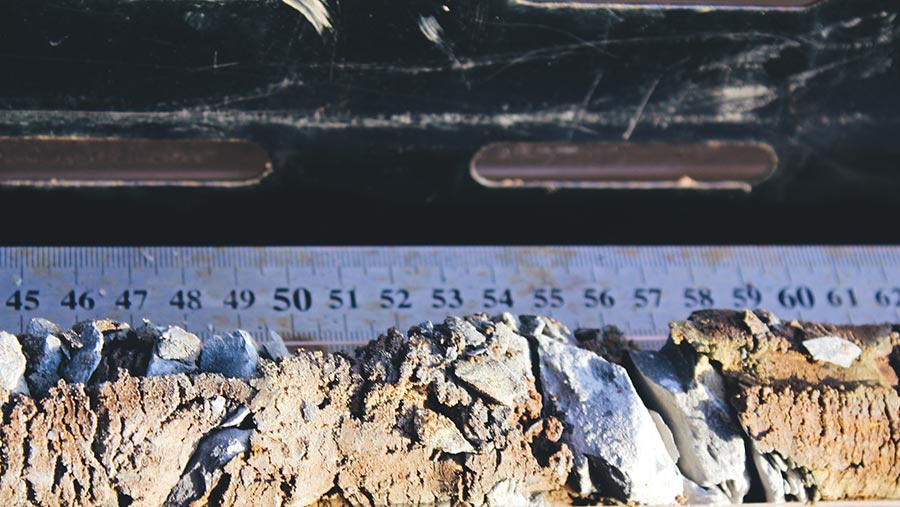
The field operators use Agricarbon’s modified ATVs, equipped with powerful hydraulic core extractors, to collect wide-bore cores to 1m deep.
Sealed tubes and specialised pallet boxes ensure that the soil structure in each core is maintained in transit back to the processing facility in Dundee, where they are subdivided into multiple samples to represent the different soil depths.
In Dundee, robotics and industrial-scale automation perform sample preparation and analysis, which uses the widely accepted Dumas dry combustion method for analysing soil carbon.
Prototype machine
The early prototype machine, built incorporating many components from household appliances, has evolved into Automated Soil Carbon Analysis (Acas) machines capable of processing 1,000 samples a day.
“Creating an automated solution that produces repeatable results while handling a very varied input material – soil – was a significant mechanical challenge,” Ms Leeson says.
“But the results from the Wageningen lab study show a 10-fold improvement in accuracy and consistency compared with many European labs.”
Samples are not composited – the high throughput allows each sample to be analysed individually at low cost.
In fact, each soil core is subdivided into different soil depth profiles for analysis. In addition, stone content and total bulk density for each sample is measured – crucial for converting soil organic carbon percentage into total tonnes of carbon.
The firm aims for a 28-day turnaround time on the results, although it can be faster if necessary, Ms Leeson says.
“Customers get a report that provides information about carbon stock for the whole farm and each field, including how it changes over depth. It also shows soil carbon percentage and a measure of soil compaction.”
Bolt-on analyses of nutrients, trace elements and soil carbon dynamic indicators, such as total nitrogen, active carbon and soil texture, are also available.
The service is available to individual farmers, as well as larger companies – First Milk was an early adopter of the service, according to Ms Leeson.
Cost varies by project size and requirements, with the most intensive sampling regime, including other basic nutrient tests, costing about £30/ha.
Costs reduce when data analysis shows lower-intensity sampling provides reliable measurement and will be able to detect change.
“There is no point paying for a baseline today – even a cheap one – if it isn’t robust enough to show an increase in soil carbon has been achieved in future years,” Ms Leeson concludes.
Explore more / Transition
During the series we follow our group of 16 Transition Farmers through the challenges and opportunities as they seek to improve their farm businesses.
Transition is an independent editorial initiative supported by our UK-wide network of partners, who have made it possible to bring you this series.
Visit the Transition content hub to find out more.