
What is the optimum N rate for sugar beet this season?
 © BBRO
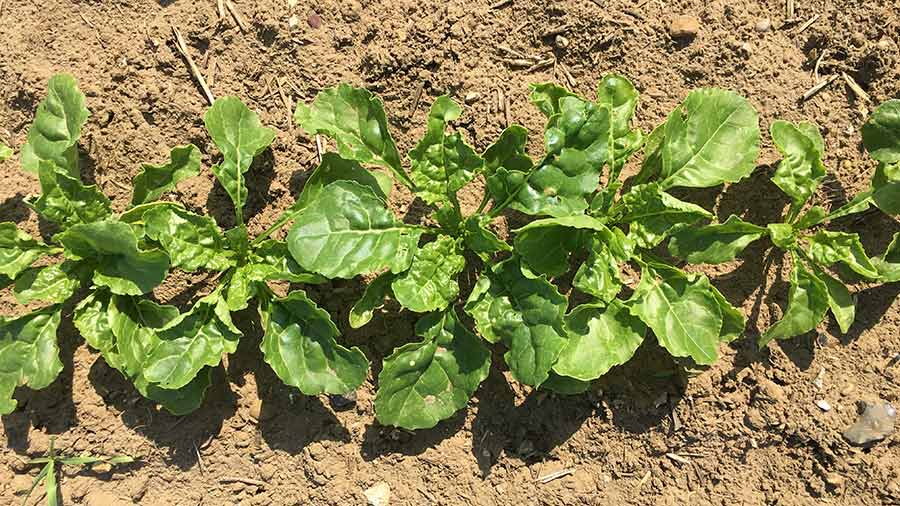
 Modest nitrogen fertiliser cutbacks of 20-30kg N/ha are being advised for sugar beet growers as the 2023 drilling campaign nears.
Despite the increased beet value of £40/t, current nitrogen prices mean the standard 120kg N/ha is no longer economically viable. This would otherwise require a breakeven fertiliser price between £250-£300/t.
The British Beet Research Organisation (BBRO) is, therefore, recommending an optimum rate between 90-100kg N/ha.
See also: Farmer Focus: Recent sugar beet yields do not make pleasant reading
An effective compromise
Simon Bowen, head of knowledge exchange at the organisation, explains the economic optimum “on-paper” was nearer 75kg N/ha, but this was considered too low for many crops.
“Reducing rates as low as this would negatively impact overall crop performance and profitability. A rate of 90-100 kg N/ha is a sensible compromise,” says Dr Bowen.
Last year, when fertiliser prices first escalated, growers successfully cut back rates by 20kg N/ha with some as low as 30kg N/ha.
There was no evidence to suggest a detrimental impact on performance and canopy development in terms of nitrogen availability.
“However, on very light, ‘hungry soils’ with lower nitrogen reserves, growers should be wary of reductions,” warns Dr Bowen.
Taking a soil mineral nitrogen (SMN) test in the spring can provide a broad guide on how much residual ammonium-N and nitrate-N is in the soil, and can be useful to decide on the appropriate N reduction rate.
If a SMN test measures less than 40kg N/ha, growers may want to be more conservative about how much they trim nitrogen rates by.
N rates and timings
“Early nitrogen application is essential for rapid sugar beet canopy formation as the main requirement of nitrogen is leaf growth,” continues Dr Bowen.
Beet crops grown in mineral soils typically contain about 230-250kg N/ha at harvest, but 75-80% of this N is taken up by the end of July.
“During the phase of rapid leaf canopy expansion in June and July, uptake rates average 4-5kg N/ha per day.
“It is important to ensure sufficient nitrogen is available to drive early canopy growth, especially in dry springs when applied nitrogen may sit on the soil surface and not reach the rooting zone,” he says.
Fertiliser applications should, therefore, be applied in two splits, with 30-50kg N/ha applied at drilling to aid rapid early leaf development and the remaining 50-70kg N/ha applied soon after emergence to support growth.
Dr Bowen highlights how the precise placement of N at drilling allows crops to use N more efficiently.
“Placing a band of solid or liquid fertiliser at a depth of 5-7cm below and to the side of the seed encourages earlier canopy development and proves an effective way to increase nitrogen use efficiency.”
Commercial strip trials investigating accurate fertiliser placement have shown that reducing the 120kg N/ha rate by 15-20% is possible, but this is often dependent on soil type.
“However, if using the lower 100kg N/ha rate, be wary of reducing rates by too much,” he says.
Account for other N sources
Accounting for other sources of nitrogen, such as manures, digestate or cover crops, is important when calculating rates. Applying excess nitrogen is costly and can have a detrimental effect on sugar content.
“This year has seen fantastic cover crop growth and biomass. A good legume-based cover can add between 30-80kg/ha of available nitrogen to the soil.
“Growers have previously been reluctant to account for this nitrogen, but, with current prices, cover mixes provide a significant chunk of available nitrogen.”
The use of a SMN test can help identify nitrogen levels and potential savings from cover crop mixes.
Dr Bowen adds that nitrogen rates over 120kg N/ha decreases sugar content. Higher rates encourage leafy top growth and lowers the proportion of storage root dry matter which accumulates as sugar.
This also creates impurities such as amino-N in the roots. The effect is intensified when large amounts of organic manure is applied and during times of drought.
Optimal pH
Dr Bowen highlights why maintaining a pH of between 6.5-7 is important as sugar beet performance drops in acidic soils.
“A pH below 6.5 slows N fixation, which can see beet crops run into nitrogen problems associated with poor availability and inefficient use.”
P and K
Applications of phosphorus (P) and potassium (K) are often used as a maintenance dressing to replace crop offtake.
Crop offtake is about 1.7 kg/t of K20 and 0.8 kg/t of P205 for every tonne of sugar beet roots produced.
High input costs are prompting some growers to take P and K holidays, but Simon Bowen highlights the importance of fresh P and K helping to support early growth and development.
“When no potash is applied on index 0 and 1 soils, yield will be potentially lost, especially on light sandy soils,” he says.
Be wary of cutting rates back by more than 50% from the recommended rates (130-160 kg K/ha) especially on very light sandy soils where the retention of K can be challenging.
Soils with a higher K index can support yields, but soil reserves will be depleted and require replenishing at a later date.
BBRO trials reveal the P concentration required for optimum sugar yield is 15-20mg of P/g soil – the equivalent to P soil index 2.
As the majority of sugar beet crops are grown on P index 2 soils, there is scope for reducing rates.
However, applying 30-40kg P/ha of fresh water soluble phosphate at drilling can assist with early root and shoot growth in young seedlings, especially when root function and nutrient uptake is limited.
Calculating rates
Based on a crop value of £40/t, the table below shows a range of N fertiliser prices at different rates between 60 and 120kg N/ha.
Crop return versus the total cost of ammonium nitrate (AN) nitrogen is calculated from a standard yield-response graph using a base rate and yield of 30kg N/ha, and an adjusted yield of 66t/ha.
Where the total cost of N is greater than the response to each increment, this is shown in red.
- The table below applies to soils with soil nitrogen supply (SNS) index 0 and 1. Lower economic optimums will apply to SNS indices 2 and 3 soils.
- Classify SNS index based on previous cropping, soil type and winter rainfall. Use the Nutrient Management Guide (RB209) as a reference.
- Look at overall budgeted yield as part of the decision to reduce N. Do not base it on the N fertiliser response curve alone.
Calculating N rates |
|||||||||||
|
|
Fertiliser price (£/t) |
250 |
300 |
350 |
400 |
450 |
500 |
550 |
600 |
650 |
700 |
|
|
N/kg cost (based on AN 34.5%) |
0.72 |
0.86 |
1.01 |
1.15 |
1.30 |
1.44 |
1.59 |
1.73 |
1.88 |
2.02 |
|
N rate |
Additional yield value over: |
Total £/ha |
|||||||||
|
60kg N/ha |
30kg N/ha £400/ha |
43 |
52 |
61 |
69 |
78 |
86 |
95 |
104 |
113 |
121 |
|
75kg N/ha |
60kg N/ha £160/ha |
54 |
64 |
76 |
86 |
97 |
108 |
119 |
129 |
141 |
151 |
|
90kg N/ha |
75kg N/ha £140/ha |
65 |
77 |
91 |
103 |
117 |
130 |
143 |
155 |
169 |
182 |
|
100kg N/ha |
90kg N/ha £120/ha |
72 |
86 |
101 |
115 |
130 |
144 |
159 |
173 |
188 |
202 |
|
120kg N/ha |
100kg N/ha £100/ha |
86 |
103 |
121 |
138 |
156 |
172 |
191 |
207 |
225 |
242 |
|
Key: Green – response to each increment is greater than total cost of N. Yellow – response is borderline-dependent on field type. Red – total cost of N is greater than response to each increment. Source: BBRO |
|||||||||||